

Table of Contents
- Introduction to APIs
- Opening a JSON file from the web
- Using an API with Power Query
- Making an app_identifier for HDX HAPI
- Building an HDX HAPI Query URL
- Get more control with the Advanced Editor
- Using Power Query in Power BI
- Summary
Introduction to APIs
Application Programming Interfaces (APIs) are a standard way for computers to communicate with each other. In this article I am going to show how to use Power Query to access data sources on the web via APIs. Power Query is a feature available in versions of the Excel desktop app after 2016 and in the online version of Excel in Microsoft 365, as well as Power BI.
I will use the HDX Humanitarian API (HDX HAPI) as an example data source but the methods described here are general. HDX HAPI is a system for accessing humanitarian data hosted by the UN Office for the Coordination of Humanitarian Aid (UNOCHA), it is a project I first worked on at its foundation 10 years ago.
This tutorial shows how to access the data in HDX HAPI using the Excel “point and click” interface, and then by editing the text of the query in the Power Query Advanced Editor which allows more complex processing of the data – including paging data in an API until it has all been downloaded.
Opening a JSON file from the web
The simplest data we can access from HDX HAPI is the machine-readable description of the API, including the available endpoints, which is found in a file at https://hapi.humdata.org/openapi.json. We start with this because we don’t have to worry about authorization or building a complex query URL, so we can focus on the process in Excel Power Query. The file we are reading is in JSON format and looks like this in the browser:
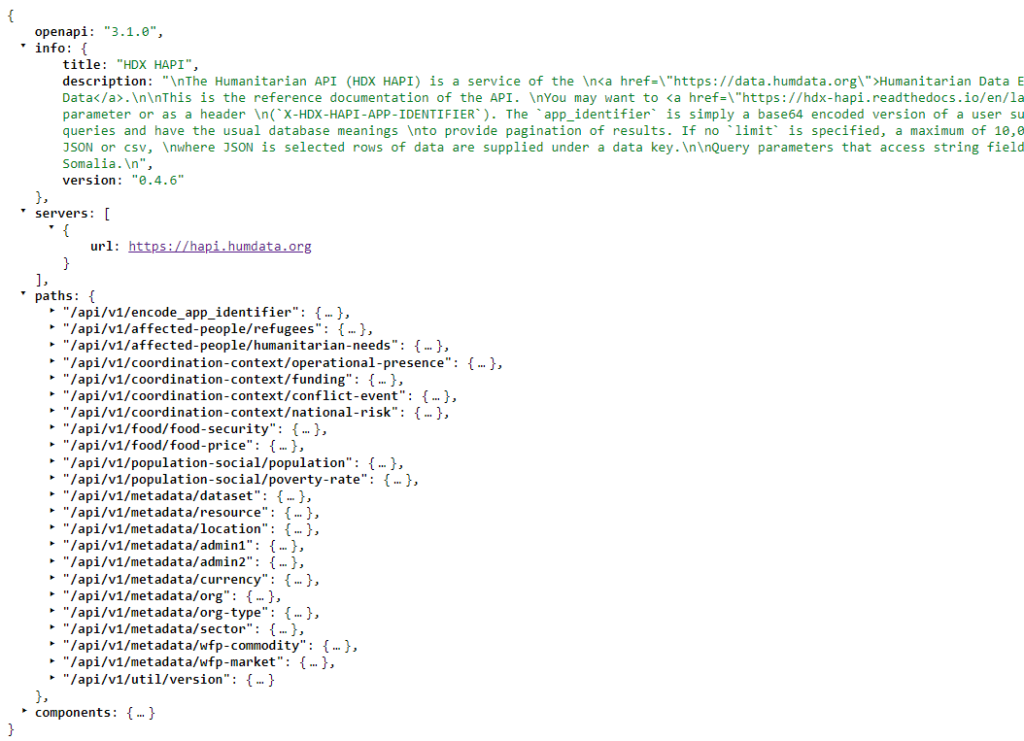
This is a simplified view, there is further information including a summary and description for each path in the paths section which we have hidden.
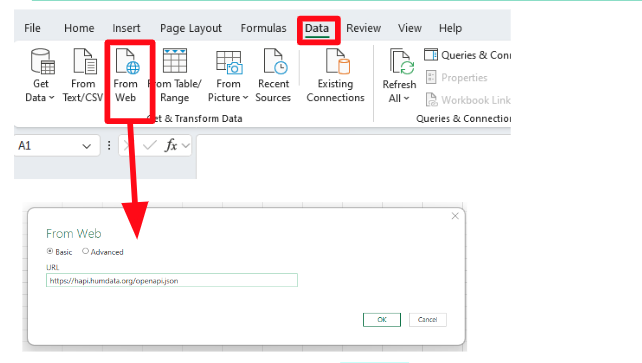
To open this file in Power Query we go to the Data tab in Excel and click the From Web button. This pops up a From Web dialog box with a space to add a URL – so we paste our URL in there and click “OK”.
This brings up the Power Query Editor and shows us this data:
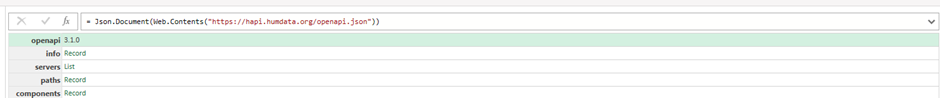
We are interested in the paths section because that lists the different datasets in the API. If we click on the green record next to paths then we see a list of the endpoints:
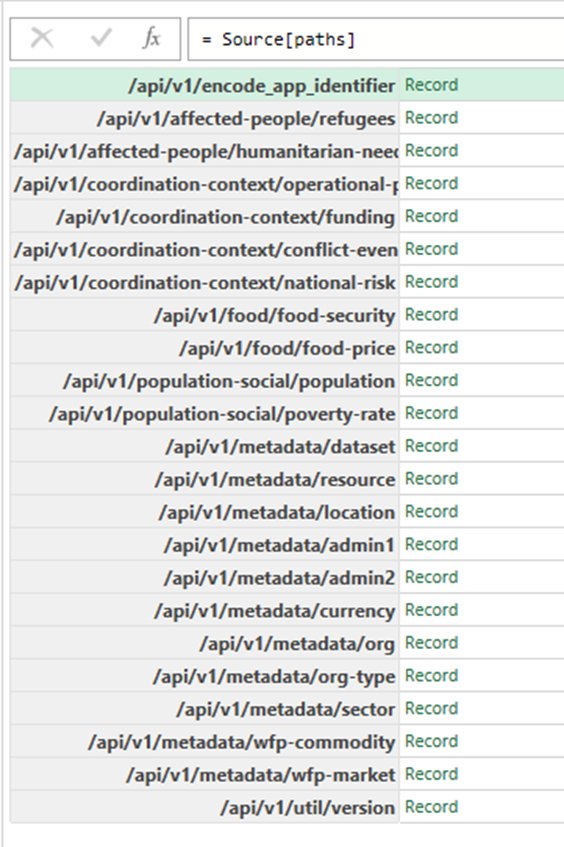
We can pull them into an Excel spreadsheet by clicking Into Table and then Close & Load buttons. This gives us a list of the available endpoints in an Excel table.
Using an API with Power Query
Next we will load data from one of the HDX HAPI endpoints using Power Query. We’ll use the metadata/admin2 endpoint which contains a table of data about geographic administrative areas. We start by visiting the HDX HAPI API documentation page (https://hapi.humdata.org/docs#) which allows us to try out queries to the API, the output of this process is a query URL which contains all the information we need to make a query to the API.
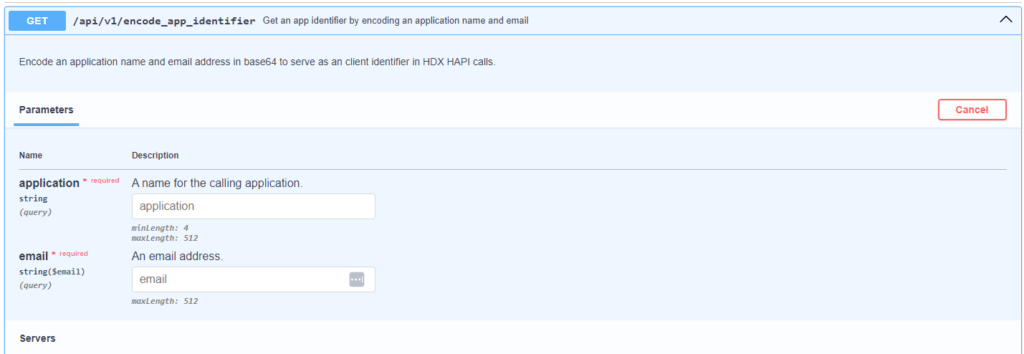
Making an app_identifier for HDX HAPI
The first step is to make an app_identifier HDX HAPI which we will use to authorize subsequent queries – that is done with this query: (https://hapi.humdata.org/docs#/Generate%20App%20Identifier/get_encoded_identifier_api_v1_encode_app_identifier_get ), we need to provide and an email address and an application name:
Building an HDX HAPI Query URL
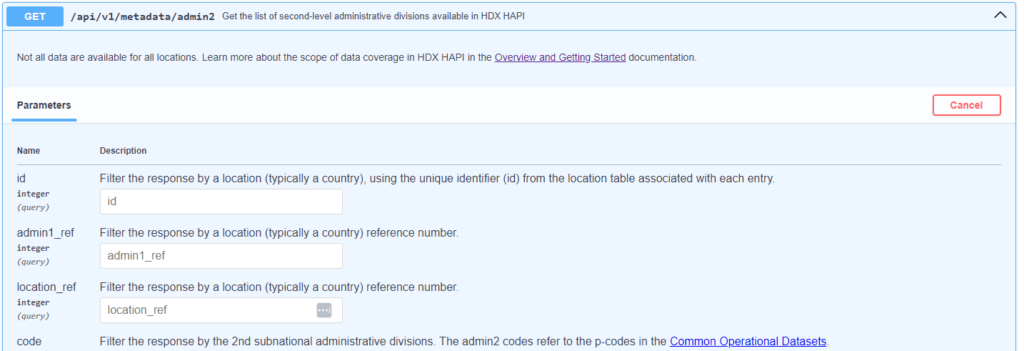
The next step is to design a query for the dataset we are interested in, remembering to include the app_identifier we have just made. Typically the query endpoints allow the user to supply a number of filters to limit the number of rows of data returned. You might prefer to do this type of filtering once you have the data in Excel or Power BI although for some datasets the amount of data returned will be large in which case limiting the data returned by country using the location_code or location_name query parameters is probably the best place to start.
The documentation for the metadata/admin2 endpoint can be found here: https://hapi.humdata.org/docs#/Metadata/get_admin2_api_v1_metadata_admin2_get
From this we can make the following query URL:
Notice that we have selected CSV output_format in this case, and we have set the number of rows returned to 6000. I have put in a placeholder for the app_identifier – you should past in the value you created above.
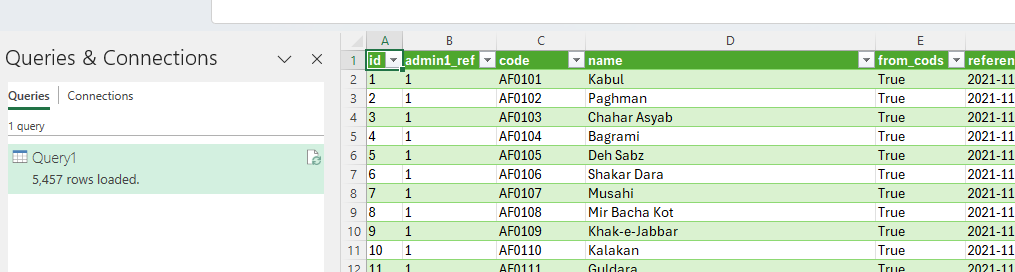
We can get the data by simply copying this URL into the Data->From Web dialogue box, since the data is in CSV format no further steps are required to fetch the data. On returning to Excel we should see this:
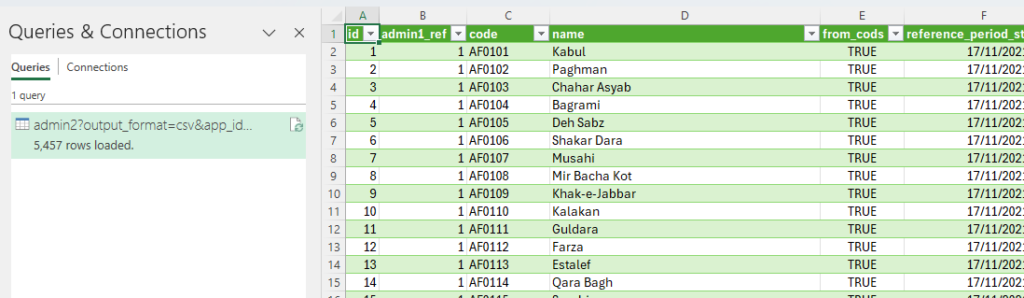
Notice that we downloaded 5,457 rows which is all of this dataset, luckily we set the limit to 6000 rows so we got all the data in one query. We talk more about this below when we discuss the use of the Advanced Editor.
Once we’ve loaded data into an Excel table we can process and the chart the data in any way we see fit.
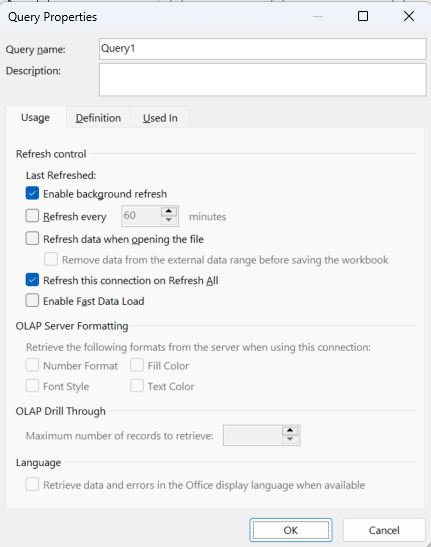
If we right-click the query entry in the Queries & Connections section we get query properties which allow us to control when data is refreshed – this means we can build a “live” report in Excel whose data is updated every time we open it or even more frequently:
Get more control with the Advanced Editor
For both the OpenAPI definition query and the HDX HAPI query we were able to get useful data without coding, just using the “point and click” interface. We can get more control of the data import process by using Power Query’s Advanced Editor.
The Advanced Editor is accessed in one of two ways, if we have an existing query then we can return to our Power Query Editor window we can click on the Advanced Editor button in the Home tab. Alternatively we can go to the Excel Data tab and select Get Data->Launch Power Query Editor and then on the right of the window select New Source->Other Sources->Blank Query, and then click on the Advanced Editor button, as before.
For the OpenAPI import the text of the query that Excel made as a result of our point and clicking looks like this:
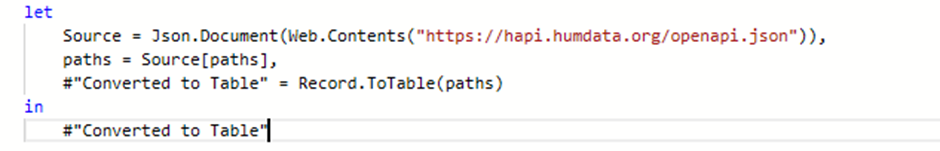
It is written in M Language which is not found outside Power Query – the “M” stands for “Mashup” and it bears some resemblance to Microsoft’s functional programming language “F Sharp”. In M Language a function is defined with the “let” keyword and the returned value is found after the “in” keyword. Statements are separated with commas. Arrays are defined with curly brackets, and the data inside associative arrays are created and accessed using square brackets. Variable names can contain spaces but in this case they must be enclosed in double quote marks and preceded by a #.
We can improve our OpenAPI import by writing our own query which extracts the summary and description columns for each endpoint and presents them together in a table:
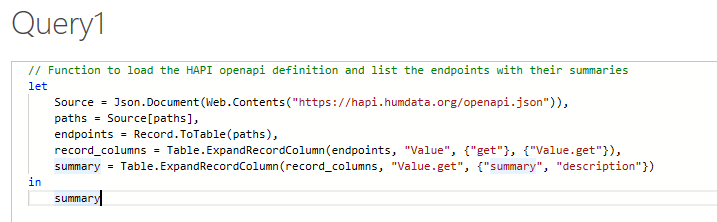
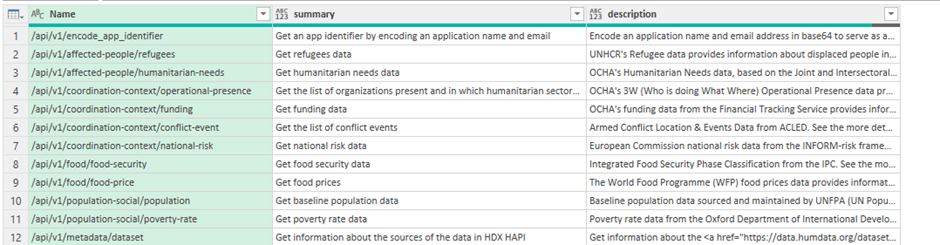
The text for this query can be found here. When we click Done on this query we see the endpoints are now listed with summaries and descriptions:
For the query to the metadata/admin2 HDX HAPI endpoint we had a small issue in that we had to guess how many rows of data there were, and set the limit parameter larger than this value. This approach is not great because we had to discover this by trial and error, and if there had been more than 10,000 rows, the maximum we can supply to the API, we would have been stuck.
We can fix this issue by copy/pasting the following code into the Power Query Advanced Editor as we did above, remembering to add in our own app_identifier:
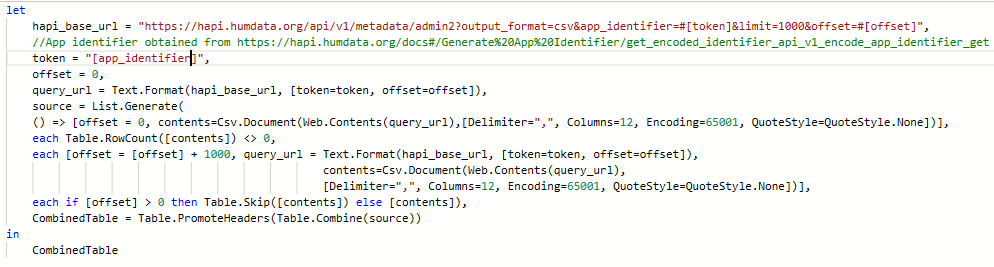
The text for this query can be found here.
This function will compile all of the data for the query into a single table, continuing to fetch data until it reaches the end of the dataset. It works by using the List.Generate function to produce a list of tables of data which use a sequence of offset query parameters – you can think of the offset as a start point for a new page of data. The list terminates when no data is returned and then the list of tables is combined into one table to put into Excel. There is a little bit of code to ensure that we don’t repeat the column headers inside our data, which in CSV format are returned for each page.
The result of running this function looks like this:
As you can see, we have loaded all 5,457 rows.
A benefit of the Advanced Editor approach is that it is easy to share simple recipes for fetching and processing data with others.
Using Power Query in Power BI
In the above we used Power Query in Excel to access data in HDX HAPI, the process in Power BI should be nearly identical. The only difference is that the Get Data menu item appears on the Home menu of Power BI. In practice we found that the OpenAPI query failed using the “point and click” method although both queries worked using the Advanced Editor route.
Summary
We have shown how Excel’s Power Query language can be used to access the data in HDX HAPI, first by using the “point and click” interface but then by making use of more sophisticated queries in the Power Query Advanced Editor which select particular items of data or retrieve multiple pages automatically. We also show how refreshing the data from the API can be controlled. The techniques demonstrated here should apply to any API which returns JSON or CSV format data on the basis of simple HTTP GET requests.